
Le monde des affaires guette le volume de ventes industrielles après la fête du travail

The Labor Day weekend is here, a time of late summer travel, family cook outs and neighborhood block parties. It’s the time to enjoy a few days of relaxation -- but it’s also the proverbial calm before the storm in the industrial capital markets sector. The post Labor Day period marks a busy, often frenzied, time when transactions launch into high gear as many focus on closing deals by year-end. In this issue, we take a historical look at sales volume and the impact of the post Labor Day sales cycle.
Best,
Erik Foster
Principal
Head of Industrial Capital Markets
Expected surge in post Labor Day sales volume
A review of sales volumes dating back to 2011 shows that the majority of sales were recorded during the third and fourth quarters of each year. While there are anomalies, this pattern has been repeated many times over the past 10 years. According to Real Capital Analytics (RCA), the last two quarters of 2019 -- a record year for industrial sales -- had $63.4 billion in industrial sales, more than double the $30.1 billion in the first half of that year. Another recent example is 2018, when sales volume for the last two quarters totaled $46.1 billion compared with $30.2 billion in the first half of the year.
This pattern fits a common scenario, as sales momentum grows during the year and sellers focus on the post Labor Day period for their final push to complete transactions for the year. The process of analyzing the assets, developing marketing plans, and executing the deals can require several months of activity. The final quarter of the year is also a time when investors are focusing on year-end performance and allocation goals and the need to move deals off their books -- or add new ones on -- before the year closes.
One outlier to this post Labor Day theme is 2020, when sales were more skewed due to the impact of the pandemic. There were $28.4 billion in sales for Q1, coming off the record momentum seen in 2019. However, as the pandemic impacted the market in Q2, volume dropped to $10.2 billion before edging back up again in Q3 and jumping to $34.1 billion to close out the year. Overall annual volume was strong, but more evenly spread throughout the first and fourth quarters than in previous years.
The post Labor Day investment cycle has traditionally been a time of intense focus on executing year-end strategies for seller dispositions. The Avison Young Industrial Capital Markets team sees this occurring with more intensity this year, as sellers try to recoup any lost momentum from the brief pause in activity during the pandemic. This approach applies across all seller categories, from institutions to private investors and REITS.
Pricing and asset volume grows in 2020/21
Over the past 10 years, as the industrial sector has moved into a more prominent position with investors -- and large warehouse and distribution center portfolio sales have become more commonplace -- pricing has also increased. According to RCA, the median price per square foot (psf) traded in a fairly tight band from 2011 through 2013. By 2013, there were three quarters were the median price per square foot reached over $60. Prices have escalated steadily since then, and began to soar in 2018 and 2019, reaching into the low-$90’s. Now median prices have pushed into triple digits, with top tier assets accelerating even more.

Private investors outpace institutions and REITS
Another important change in the capital markets sector is the increase in consolidation among investors. This is leading to smaller pools of players trying to control larger sections of the market. There is a strong focus on “go big or go home” which is allowing global institutional players to buy large logistics portfolios and scale up quickly, but it is also making it more challenging for national or regional investors who are trying to compete for market share.
Private buyers still constitute the largest cohort of industrial investors, especially thus far in 2021, well above the long-term annual average of 35.7% and outpacing institutions, which accounted for 24.6% of buyers and 21% of sellers. REITs had a 15.5% share of the acquisitions and a 14.8% share of the dispositions in 2021.
Cross border investment still remains a small percentage of overall transactional volumes, outside of a cadre of headline-making engagements in 2015 and over the last few years.
Market by market sales update
A look at several industrial markets across the country reinforces the importance of core markets that are tied to port activity and strong consumer populations. The Los Angeles Metro area continues to outpace many other markets for sales volume as well as other fundamentals. This is influenced by the region’s connectivity to the Los Angeles and Long Beach ports and California’s large consumer base. The market has seen a significant amount of new construction in recent years as well, creating a larger pool of assets to satisfy tenant and investor demand.
Primary and gateway markets remain attractive for investors. According to RCA, rolling average sales volume at Q2 2021 was $11.5 billion in Los Angeles Metro; $5.6 billion in New York Metro; $4.4 billion in Dallas; $4.3 billion in Chicago; and $3.7 billion in Atlanta. Sales volumes have nearly doubled in Los Angeles since Q2 of 2017. Atlanta’s volume more than doubled in that time frame, from $1.5 billion. Additionally, over that same period, the New York Metro increased from $3.8 billion; Dallas increased from $2.5 billion; and Chicago increased from $2.8 billion.
The Inland Empire continues to account for significant activity, with Q2 2021 capital deployment on industrial seeing a 37.7 percent increase over the prior five-year average. This momentum has contributed to valuations that are 9.1% higher psf than the trailing five-year average. Sales reached $157 psf in the first half of 2021, according to Avison Young research.
We have seen investment volumes increasing in the first half of 2021 following the more moderate pace that occurred in mid-year 2020 due to the pandemic. We expect this momentum to continue given the incredible appetite for assets that support e-commerce and the broader logistics network.
Sources: AVANT by Avison Young Avant, Real Capital Analytics, Avison Young Industrial Capital Markets
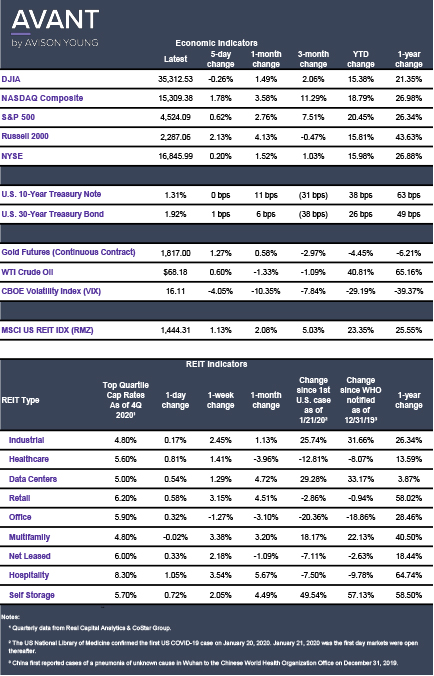
Click the image for Economic Indicators
Erik Foster, Principal
Head of Industrial Capital Markets
312.273.9486
[email protected]